Posted on 15 Comments

#41: Datalogging with MQTT, Node-RED, InfluxDB, and Grafana

Note: This page is still a draft! The instructions are still incomplete.

Resources

The plan

Whatever data source you want to record, there are a few common building blocks that you will need. Each of these building blocks has multiple alternatives. There are also totally different architectures that do things in a different way.

However, this particular combination of software is ideal for home automation, because these software building blocks can also be used for other purposes within your overall system.

You can install the various software elements on different computers, or in virtual machines, or using Docker containers, or on a NAS, or in many other ways.

To keep it simple and because many people already have one spare, we’re going to use a Raspberry Pi.

Prepare Raspberry Pi

Begin by installing Raspberry Pi OS (formerly known as “Raspbian”) on your Raspberry Pi. The easiest way to do it these days is to use the Raspberry Pi Imager, which runs on Windows, MacOS, or Linux and can be downloaded from www.raspberrypi.org/downloads/.

Use the Imager to download and install Raspberry Pi OS onto a micro SD card, insert it into your Pi, and start it up.

TODO: logging in first time.

Make sure your Pi has the latest packages by applying all updates:

sudo apt update
sudo apt upgrade

You now have a Raspberry Pi with a basic Raspbian OS installation, ready for customisation.

Step 0: Get the IP address

We’ll need to know the IP address of the Raspberry Pi later. If you’ve connected using the hostname or you’re using a screen and keyboard, you can get the

Step 1: Install the Mosquitto MQTT broker and clients

There are many different MQTT brokers available, but Mosquitto is the most popular and it has served me well for many years. Install both the “mosquitto” package and the “mosquitto-clients” package, so that you have both the broker and some handy command line clients that you can use for testing:

sudo apt install mosquitto mosquitto-clients

The Mosquitto broker will be set up with a default configuration and will work fine out of the box, but we’re going to change the configuration to make it more secure.

You can leave your MQTT broker unprotected, but it’s a good idea to set a username and password on it.

First, create a text file that contains the username and password with a colon to separate them. You can do this on the command line with a single command:

echo "mqtt_username:mqtt_password" > pwfile

This will create a text file called “pwfile” with the details in them.

Use the passwd utility provided as part of the Mosquitto package to encrypt the file:

mosquitto_passwd -U pwfile

Display the contents of the file to verify that it has now been encrypted:

cat pwfile

You will see your username in plaintext, followed by a string of gibberish which is the encrypted form of the password. If the password is still plaintext, it means the encryption command above didn’t work.

Move the encrypted file into the Mosquitto configuration directory:

sudo mv pwfile /etc/mosquitto/

Mosquitto needs to be told where the new file is located. Use an editor such as Nano to open the Mosquitto configuration file:

sudo nano /etc/mosquitto/mosquitto.conf

Near the bottom of the file, just above the “include_dir” line, add these lines:

allow_anonymous false
password_file /etc/mosquitto/pwfile

The first line tells Mosquitto to reject all anonymous connections, and require a password.

The second line tells Mosquitto where to find the list of allowed usernames and passwords.

To save your changes and exit, type CTRL+X, then Y, then ENTER.

Restart Mosquitto so that it uses the new configuration:

sudo /etc/init.d/mosquitto restart

From now on, all connections to your MQTT broker will need to supply the username and password that you configured.

Step 2: Install the InfluxDB time-series database

To install InfluxDB we can use its official repository, because the developers have provided a packages specifically for different operating systems on the Raspberry Pi.

Start by fetching the official repository key and adding it to the local keyring:

wget -qO- https://repos.influxdata.com/influxdb.key | sudo apt-key add -

Now you can add the repository. There are a few different versions available, so you need to copy and paste the command that matches your operating system.

To find out what version you’re running, you can type the following command:

lsb_release -a

This is will report the operating system type and version, usually with a codename like “Stretch” or “Buster”. Copy and paste the command that matches your system.

For Raspbian Stretch:

echo "deb https://repos.influxdata.com/debian stretch stable" | sudo tee /etc/apt/sources.list.d/influxdb.list

For Raspbian Buster:

echo "deb https://repos.influxdata.com/debian buster stable" | sudo tee /etc/apt/sources.list.d/influxdb.list

For Ubuntu 20.04LTS:

echo "deb https://repos.influxdata.com/ubuntu focal stable" | sudo tee /etc/apt/sources.list.d/influxdb.list

For Ubuntu 18.04LTS:

echo "deb https://repos.influxdata.com/ubuntu bionic stable" | sudo tee /etc/apt/sources.list.d/influxdb.list

Now that the repository has been added, we need to update the list of packages that are available:

sudo apt update

Install the database package:

sudo apt install influxdb

Tell the systemctl service manager to enable InfluxDB at startup:

sudo systemctl unmask influxdb
sudo systemctl enable influxdb

Start InfluxDB manually this time. In future, it will be started automatically whenever your Raspberry Pi boots up:

sudo systemctl start influxdb

Let’s set up access control for InfluxDB before we do anything else. The default installation of InfluxDB leaves the system wide open, so we’ll start by creating an admin user and setting a password.

Connect to InfluxDB by running the client. We don’t need to use a username or password this time, because nothing has been set yet:

influx

Create a user called “admin”, and put in the password you want to use for it:

CREATE USER admin WITH PASSWORD 'adminpassword' WITH ALL PRIVILEGES

Now you can exit out of InfluxDB. Simply type “exit” and press ENTER.

exit

The InfluxDB configuration needs to be edited so that it will use authentication. Otherwise the admin user that we just created will be ignored. Use a text editor to open the InfluxDB config file:

sudo nano /etc/influxdb/influxdb.conf

Press CTRL+W to search for the section called [HTTP].

auth-enabled = true
pprof-enabled = true
pprof-auth-enabled = true
ping-auth-enabled = true

To save your changes and exit, type CTRL+X, then Y, then ENTER.

The config change won’t be applied until InfluxDB has been restarted, so restart it manually:

sudo systemctl restart influxdb

From now on, any time you want to connect to the InfluxDB command line you will need to supply the username and password.

We need to do that now, so substitute the password you set:

influx -username admin -password <adminpassword>

If the previous changes worked, you should now be connected to InfluxDB again and authenticated as the admin user that you just created.

Next we need to tell InfluxDB to create a database where we can store sensor data. In this example I’ve simply called the database “sensors”:

CREATE DATABASE sensors

That was easy! Because of the way InfluxDB works, there’s no need to create a schema with tables and columns like you would be a relational database such as MariaDB, MySQL, Postgres, or SQL Server.

All you need to do is create an empty database, and it will be automatically populated when you start sending data to it.

Leave the InfluxDB client by typing exit, as before:

exit

Step 3: Install Node-RED

There are several different ways to install Node-RED, and it’s readily available in the Raspbery OS packaging system. However, the Node-RED team recommend that you do NOT use the packaged version.

Instead, they provide a handy script that installs the latest version of Node-RED from the official release, and helps you keep it updated. The installation script goes far beyond that, however. It also:

  • makes sure there’s no existing installation of Node-RED and removes any that it finds in order to prevent conflicts
  • installs the latest Node.js
  • gives you the option of installing a set of useful nodes specifically designed to run on a Pi
  • sets up Node-RED to run as a service and installs tools to help you manage it

Before running the Node-RED installation script, install the tools needed by NPM to build binary modules:

sudo apt install build-essential git

Now you can run the official Node-RED installation script:

bash <(curl -sL https://raw.githubusercontent.com/node-red/linux-installers/master/deb/update-nodejs-and-nodered)

The script will ask you a couple of questions about whether you are sure you want to proceed, and whether to install Pi-specific nodes. Say “y” (yes) to both questions.

Node-RED can be extended by installing modules to give it extra features. We need to do that now so that it can connect to your InfluxDB database. Use NPM to install the InfluxDB nodes:

npm install node-red-contrib-influxdb

At this point Node-RED is be installed, but just like with InfluxDB you need to configure it to be automatically started on boot:

sudo systemctl enable nodered.service

You can start the service manually this time, but in future it will happen automatically when your Pi starts up:

sudo systemctl start nodered.service

Step 4: Install Grafana

Just like with InfluxDB, we can install Grafana by adding the official repository and installing the package. Start by fetching the public key for the repository and adding it to the local keyring:

wget -q -O - https://packages.grafana.com/gpg.key | sudo apt-key add -

Now add the repository itself:

echo "deb https://packages.grafana.com/oss/deb stable main" | sudo tee -a /etc/apt/sources.list.d/grafana.list

Update the package list (again!) and install the Grafana package:

sudo apt update
sudo apt install grafana

Just like the other packages we’ve installed, we need to enable the service so that it will start automatically:

sudo systemctl enable grafana-server

That takes care of starting Grafana at boot. For now, let’s start it manually:

sudo systemctl start grafana-server

Step 5: Configure your sensors to send data to MQTT

For each sensor that you want to log and report, you will need to go through a series of steps to ensure that the data is received by your Raspberry Pi, processed by Node-RED, stored in InfluxDB, and then charted using Grafana. This is a process that you will repeat multiple times as your build up your home automation system.

Let’s break it down into a series of simple steps.

Begin watching MQTT for messages. There won’t be any messages yet, but this is a handy technique for discovering new devices when they begin reporting to MQTT. On your Raspberry Pi, open a terminal and run the Mosquitto client command that we ran earlier:

mosquitto_sub -u mqtt_username -P mqtt_password -v -t "#"

This launches the Mosquitto client in “verbose” mode (the “-v” flag) and subscribes to all topics using the wildcard character. What this means is the client will display every message that is published by any client to any topic, and report not just the message but also the topic that it appeared in.

On a busy MQTT broker this is like drinking from a fire-hose!

However, we don’t have any sensors using our MQTT broker yet so you shouldn’t see anything happen: the terminal will just sit there waiting to display messages. Leave the terminal open so that you can see any messages that are published.

Configure sensor to report using MQTT. The exact process for this will depend on your device. Typically you will need to configure three things in your sensor:

  1. The IP address (or hostname) of your MQTT broker. In this case, it’s the IP address of the Raspberry Pi.
  2. The username and password for MQTT. We configured this way back at the start of the process. If you don’t have a username and password on your broker, you can skip this.
  3. The MQTT topics for reporting. In many devices this should default to something sensible, and you may not need to change it. For our Air Quality Sensor project, the topic will be generated automatically based on the chip ID of the ESP chip.

If you are using the example Arduino sketch for the Air Quality Sensor, open it in the Arduino IDE and go to the tab called “config.h”. Edit the broker IP address and the MQTT username / password to match your own settings:

Compile the sketch and flash it to the Air Quality Sensor, just like in the previous episodes.

After the sensor starts up with the new settings, you should see some action in the Mosquitto client! You’ll see a startup message from the sensor, and then it will periodically begin publishing its readings.

Step 6: Receiving and storing single-value sensor readings

aoeu

Step 7: Receiving and storing JSON-formatted sensor readings

aoeu

Step 8: Create a dashboard and widgets in Grafana

You can access the Grafana user interface using a web browser, by connecting to port 3000 on your Raspberry Pi. The URL will look something like:

http://192.168.1.248:3000

Substitute the IP address or hostname for your Raspberry Pi.

To log in, use the username and password “admin” and “admin”. Grafana will ask you to change the password on first login, so set it to something secure.

Posted on Leave a comment

Dot Matrix Display MQTT Message Client

The Freetronics dot matrix displays are very versatile. Toby Robb has put together a great video showing how he has set up the display to read messages from MQTT. If your home automation system incorporates MQTT this could be a great way to display information about your home.

If you are looking for an LED dot matrix display why not check out the Freetronics range of displays. They are simple to use, yet very bright for indoor and outdoor situations. Available in various colours, the 32 x 16 LED matrix can display text and graphics easily, and can be daisy-chained together for extended displays. For more information, checkout the Freetronics Dot Matrix Displays here.

Want to keep in the loop about the latest in home automation? Subscribing to SuperHouse Automation on YouTube is the best place to start!

Inspired to start work on this project? Are you working on a project you would like us to feature in this blog? The team at SuperHouse Automation would love to know! Tell us about it in the comments section below or on Facebook and Twitter.

Posted on 72 Comments

#17: Home automation control with Sonoff, Arduino, OpenHAB, and MQTT

The Sonoff from Itead Studio is a fantastic little mains-switching module with a built-in ESP8266 and WiFi. If you want an easy way to control mains devices such as lamps and fans, this could be it!

Sonoff modules are preloaded with firmware that allows them to be controlled by a phone app, so they’re very easy to get started. But that’s just the beginning: using a USB-serial converter and the Arduino IDE, you can load your own software on the Sonoff and make it do your bidding. I used the Arduino IDE to load a sketch with MQTT support and OTA (over the air) updates, allowing it to be controlled by OpenHAB.

Sonoff models mentioned in this video:

Start by adding ESP8266 support to the Arduino IDE by following the instructions at github.com/esp8266/Arduino. I used the simple “Boards Manager” method.

For OTA (over the air) update support you’ll also need to install Python 2.7.

You’ll also need a USB-serial converter with support for 3.3V I/O. I used the Freetronics USB-Serial Converter (of course!), which has a switch that lets you select 3.3V or 5V mode.

The “BasicOTABlink” example shown in the video can be found at github.com/superhouse/BasicOTABlink.

The “BasicOTARelay” example shown in the video can be found at github.com/superhouse/BasicOTARelay.

For more information, a fantastic resource is Pete Scargill’s blog post about Slampher and Sonoff.

If you want to upgrade the FLASH memory on your Sonoff, check out Pete Scargill’s blog post about upgrading ESP8266 memory.

Update 24 Sep 2016: fixed the example links.

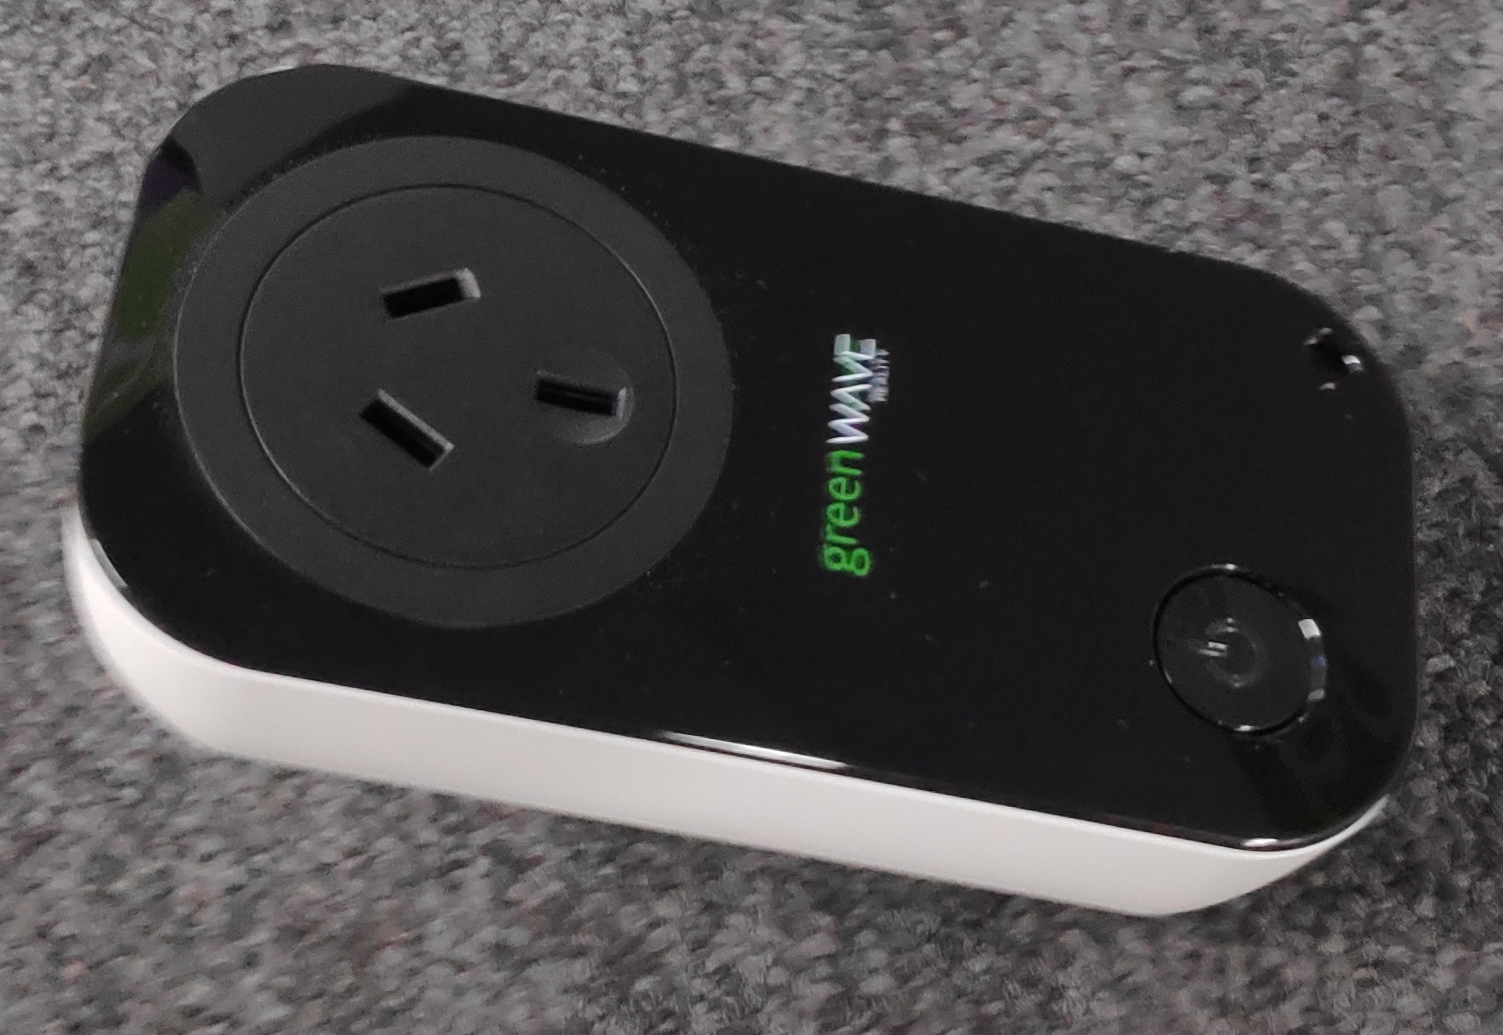
GreenWave Z-Wave PowerNode Bundle Pack

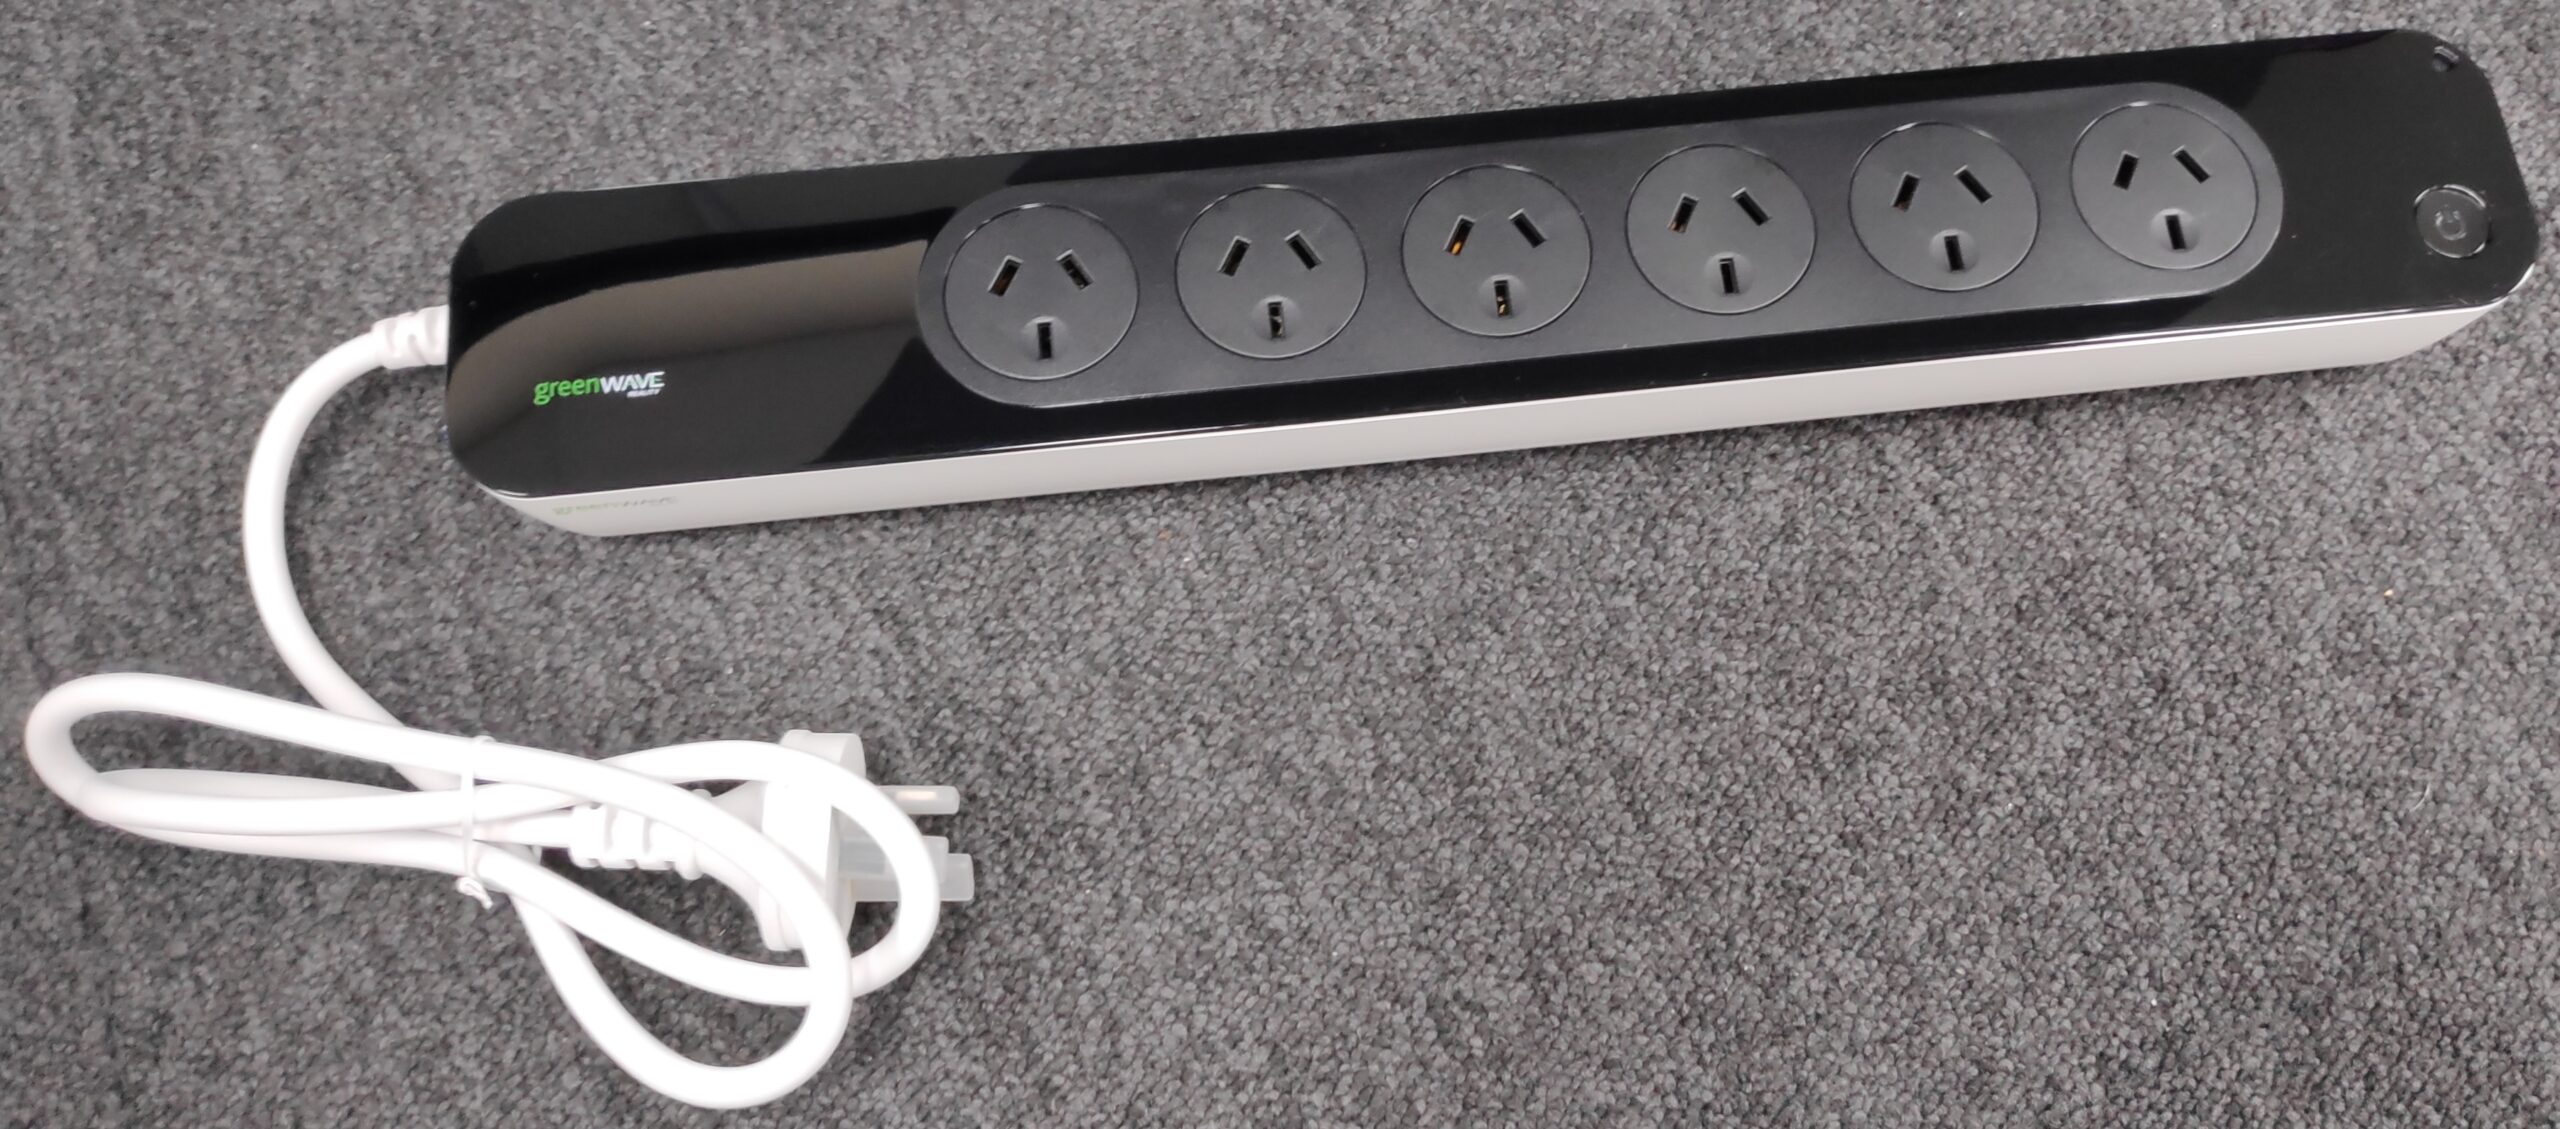
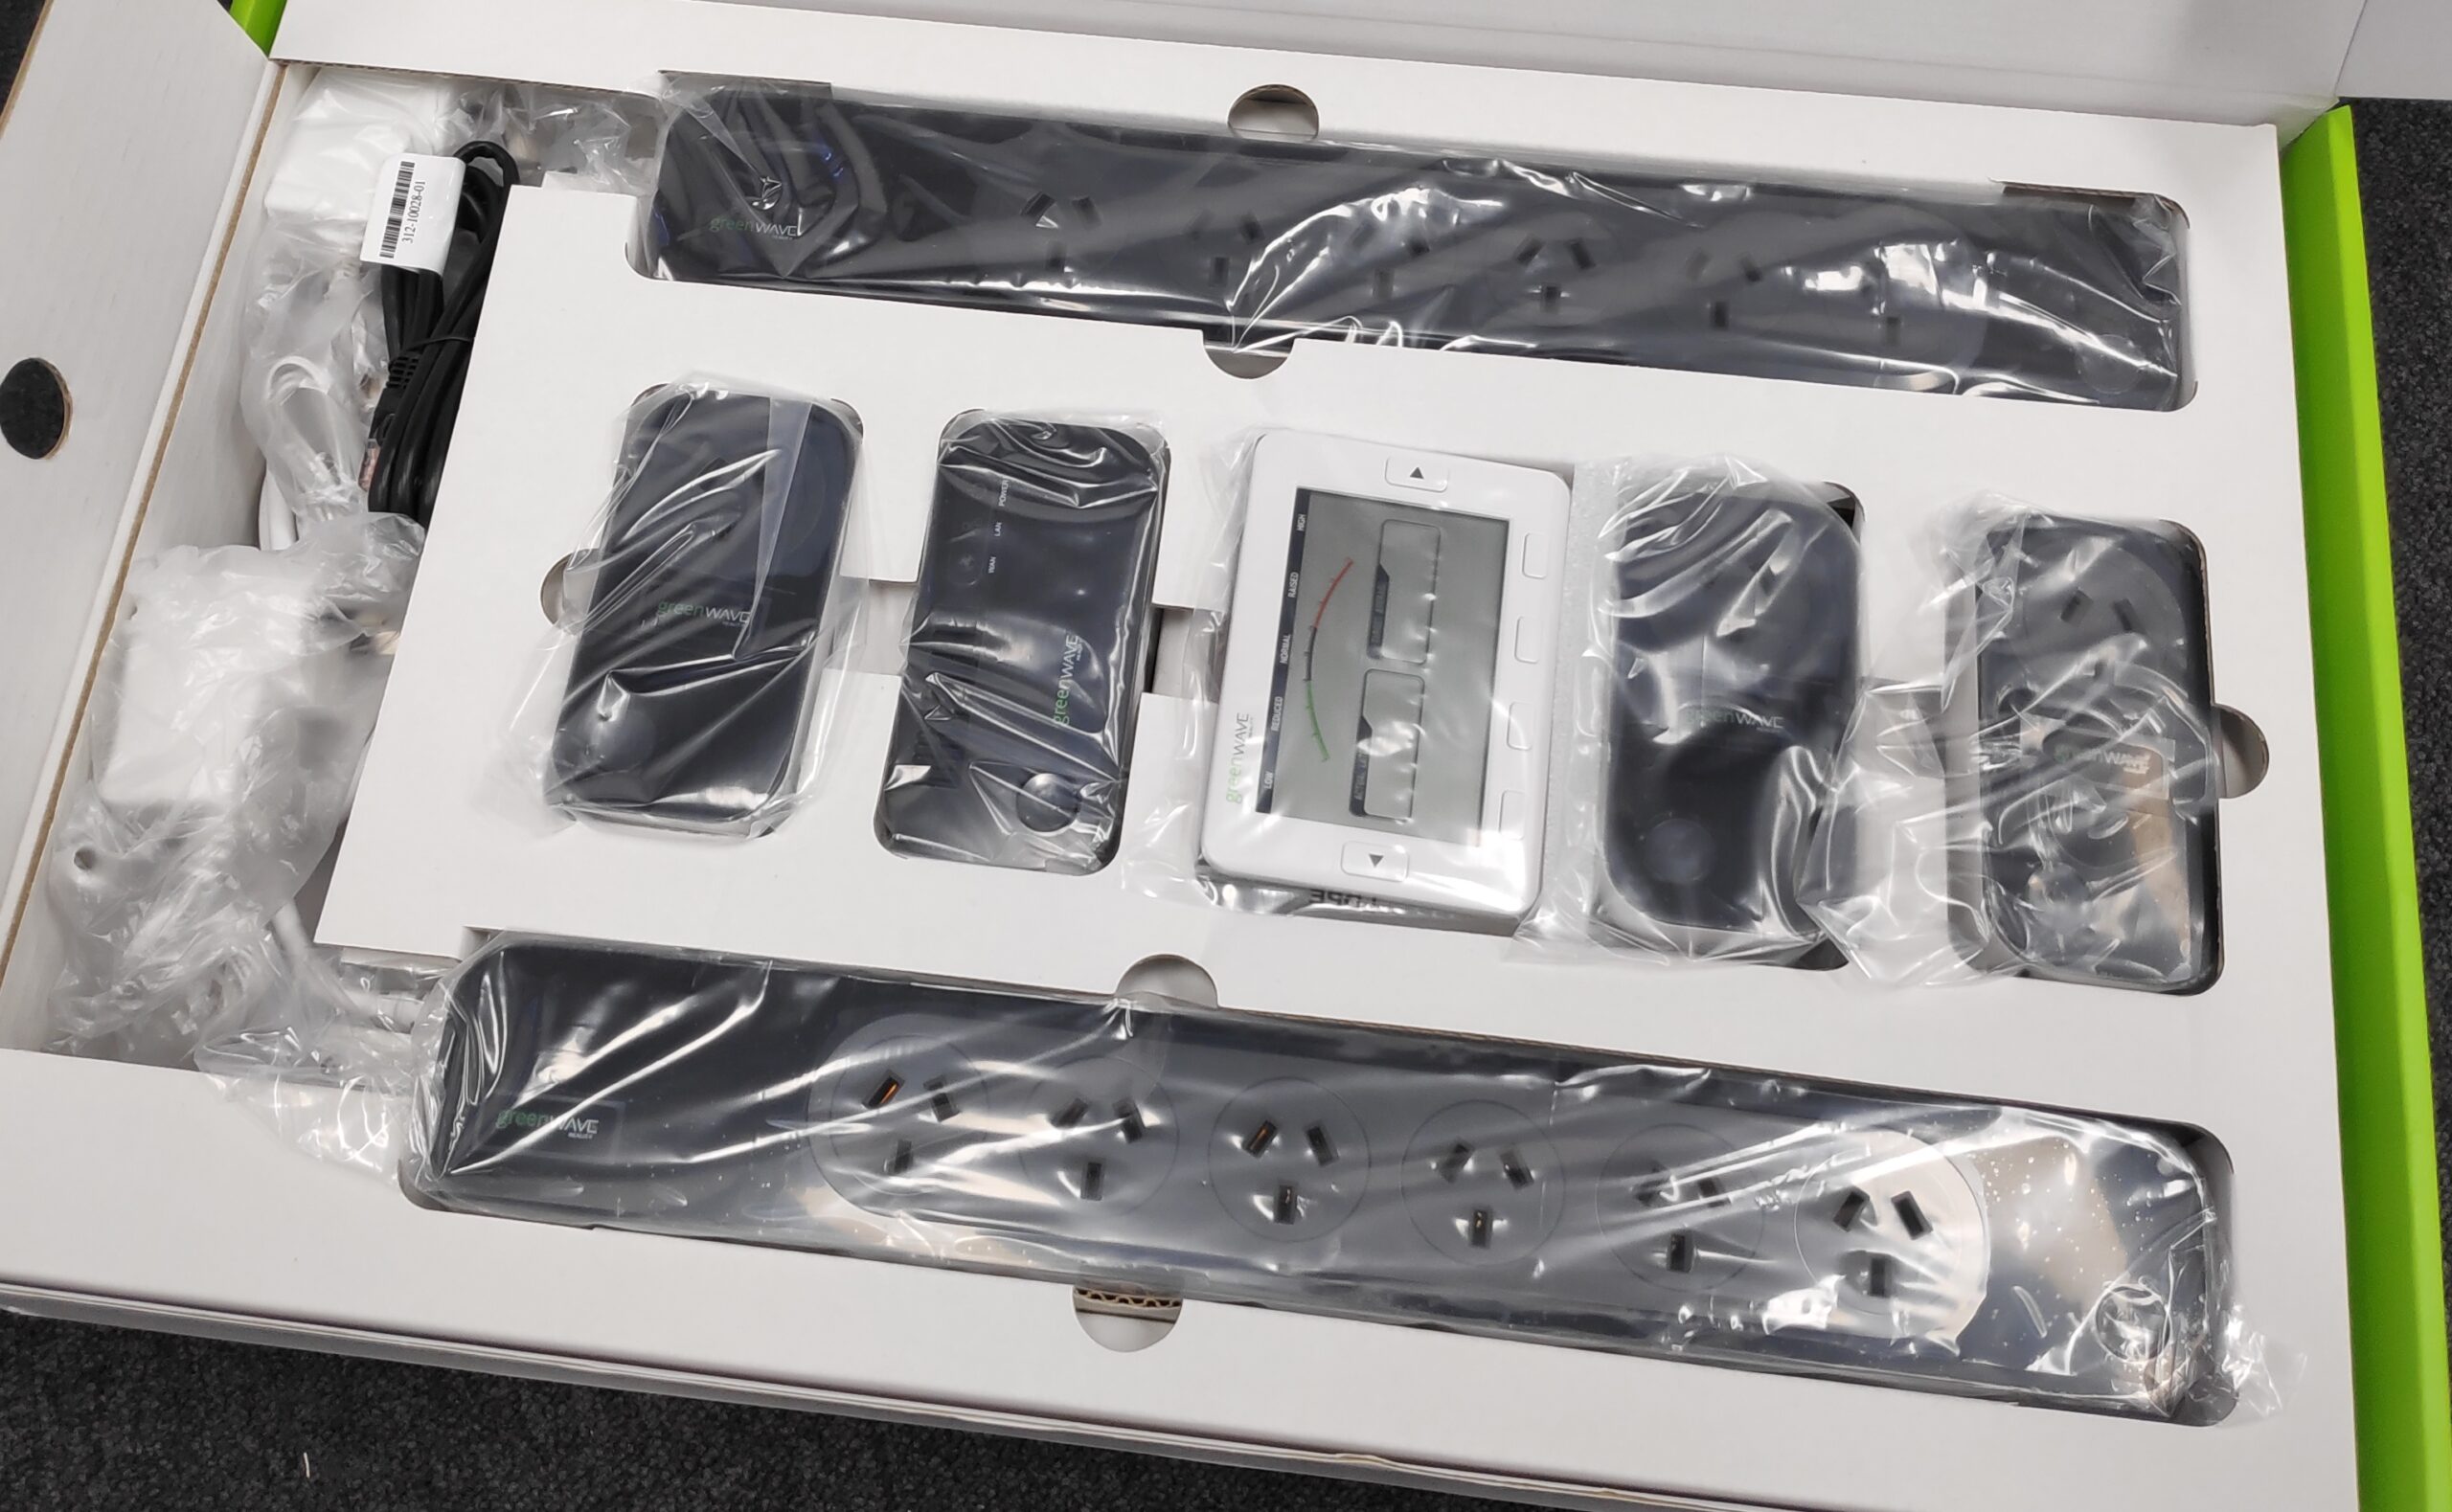
This bundle pack contains a variety of Z-Wave devices from GreenWave. The pack was originally intended to be installed as a complete system with a local gateway, status display, etc, but the original cloud service is no longer operational. The various items in the bundle can still be used as part of a DIY system.

I use the single-outlet sockets and 6-outlet powerboards at the SuperLab, controlled via a Raspberry Pi running ZWaveJS, an MQTT broker, and Node-RED, with a 5th-gen Aeotec Z-Stick.

They can be integrated into Home Assistant as well, although I don’t run that myself so I can’t provide more information on it. They probably also work with various commercial Z-Wave hubs, but I haven’t personally tested that.

Included in the bundle:

  • 2 x 6-outlet GreenWave PowerNode6 powerboards (known to work with ZWaveJS)
  • 3 x single-outlet GreenWave PowerNodes (known to work with ZWaveJS)
  • 1 x GreenWave Z-Wave gateway with Ethernet (maybe useful for hacking?)
  • 1 x GreenWave status display with LCD (maybe useful for hacking?)
  • 1 x 5V 1A power supply with a micro USB connector (good as a phone charger or to power your projects)
  • 1 x 5V 2A power supply with a 2.1mm DC power plug (good to power your projects)
  • 1 x black Ethernet cable

Note: These are offered as-is. They’re excess stock from an energy saving initiative that was run in Victoria/Australia several years ago. They’re brand new and never used, but have been in storage in a warehouse for some years.

Inclusion (Pairing)

Z-Wave networks use the term “inclusion” for adding a device to a network, and “exclusion” for removing it from a network. You can think of this like “pairing” and “unpairing”.

These GreenWave power boards and sockets come pre-included to the gateway in their bundle pack. To use them with a different gateway (such as a Raspberry Pi running ZWaveJS) you need to do 2 steps: first tell the powerboard to forget its previous link to the GreenWave gateway, and second tell it to go into “inclusion” mode so it can be added to your new gateway.

Uninclusion:

  1. With the powerboard or socket disconnected, press and hold the big round power button on the front.
  2. While still holding the button, plug it in so that it boots up. The green LED ring around the button will light up.
  3. After about 4 seconds the green LED ring will go out. It’s now successfully unincluded, and ready for you to add to your network.

If you power it up and there is no green LED ring around the button, that means it’s already been unincluded.

Inclusion:

  1. Tell your Z-Wave gateway to go into “inclusion” mode. In the case of ZWaveJS, this is done by clicking the “Actions” menu in the top right, then “MANAGE NODES”, then inclusion.
  2. Your gateway will go into inclusion mode for a short time, typically 20 seconds or so.
  3. With your powerboard or socket connected to power, press the small white “include” button on the end of the enclosure.
  4. Your gateway should almost immediately (within a second or two) detect the new device and add it to its list of managed devices.

Resources

GreenWave Z-Wave PowerNode Power Outlet

This single-outlet power socket can connect to a Z-Wave network, and allows the outlets to be controlled remotely. The power consumption of the outlet can also be reported.

I use these at the SuperLab, controlled via a Raspberry Pi running ZWaveJS, an MQTT broker, and Node-RED, with a 5th-gen Aeotec Z-Stick. They can be integrated into Home Assistant as well, although I don’t run that myself so I can’t provide more information on it. They probably also work with various commercial Z-Wave hubs, but I haven’t personally tested that.

Note: These are offered as-is. They’re excess stock from an energy saving initiative that was run in Victoria, Australia several years ago. They’re brand new and never used, but have been in storage in a warehouse for some years.

Inclusion (Pairing)

Z-Wave networks use the term “inclusion” for adding a device to a network, and “exclusion” for removing it from a network. You can think of this like “pairing” and “unpairing”.

These GreenWave power sockets come pre-included to the gateway in their matching bundle pack. To use them with a different gateway (such as a Raspberry Pi running ZWaveJS) you need to do 2 steps: first tell the power socket to forget its previous link to the GreenWave gateway, and second tell it to go into “inclusion” mode so it can be added to your new gateway.

Uninclusion:

  1. With the power socket disconnected, press and hold the big round power button on the front.
  2. While still holding the button, plug it in so that it boots up. The green LED ring around the button will light up.
  3. After about 4 seconds the green LED ring will go out. It’s now successfully unincluded, and ready for you to add to your network.

If you power it up and there is no green LED ring around the button, that means it’s already been unincluded.

Inclusion:

  1. Tell your Z-Wave gateway to go into “inclusion” mode. In the case of ZWaveJS, this is done by clicking the “Actions” menu in the top right, then “MANAGE NODES”, then inclusion.
  2. Your gateway will go into inclusion mode for a short time, typically 20 seconds or so.
  3. With your power socket connected to power, press the small white “include” button on the end of the enclosure.
  4. Your gateway should almost immediately (within a second or two) detect the new device and add it to its list of managed devices.

Resources

GreenWave 6-Way Z-Wave Powerboard

This 6-way powerboard can connect to a Z-Wave network, and allows each of the outlets to be individually controlled. The power consumption of each outlet can also be reported.

I use many of these at the SuperLab, controlled via a Raspberry Pi running ZWaveJS, an MQTT broker, and Node-RED, with a 5th-gen Aeotec Z-Stick. They can be integrated into Home Assistant as well, although I don’t run that myself so I can’t provide more information on it. They probably also work with various commercial Z-Wave hubs, but I haven’t personally tested that.

Note: These are offered as-is. They’re excess stock from an energy saving initiative that was run in Victoria, Australia several years ago. They’re brand new and never used, but have been sitting in storage in a warehouse for some years.

Inclusion (Pairing)

Z-Wave networks use the term “inclusion” for adding a device to a network, and “exclusion” for removing it from a network. You can think of this like “pairing” and “unpairing”.

These GreenWave powerboards come pre-included to the gateway in their bundle pack. To use them with a different gateway (such as a Raspberry Pi running ZWaveJS) you need to do 2 steps: first tell the powerboard to forget its previous link to the GreenWave gateway, and second tell it to go into “inclusion” mode so it can be added to your new gateway.

Uninclusion:

  1. With the powerboard disconnected, press and hold the big round power button on the front.
  2. While still holding the button, plug it in so that it boots up. The green LED ring around the button will light up.
  3. After about 4 seconds the green LED ring will go out. It’s now successfully unincluded, and ready for you to add to your network.

If you power it up and there is no green LED ring around the button, that means it’s already been unincluded.

Inclusion:

  1. Tell your Z-Wave gateway to go into “inclusion” mode. In the case of ZWaveJS, this is done by clicking the “Actions” menu in the top right, then “MANAGE NODES”, then inclusion.
  2. Your gateway will go into inclusion mode for a short time, typically 20 seconds or so.
  3. With your powerboard connected to power, press the small white “include” button on the end of the enclosure.
  4. Your gateway should almost immediately (within a second or two) detect the new device and add it to its list of managed devices.

Resources

Rack32 Quickstart Guide

The Rack32 is an ESP32-based board with Ethernet and Power-over-Ethernet support built in, and connectors for an SPI display and I2C breakout.

Power sources

The Rack32 can be powered in a few different ways. There are protection diodes on the board to allow multiple power sources to be connected simultaneously, so it should be very difficult to damage anything by connecting more than one power source. The exception is the selection of 12V vs 802.3af PoE.

Power options are:

  1. USB. Connecting to a host computer via USB will provide 5V to power the logic of the board, including the Ethernet connection. However, this will not provide the 12V that is typically passed through the I2C header to expansion boards that may be attached.
  2. Rear power connector. The 3.81mm pitch pluggable screw terminal on the back of the board allows 12Vdc to be connected. The polarity is marked on the PCB. A protection diode prevents power being back-fed.
  3. 802.3af Power-over-Ethernet. The onboard PoE regulator allows the Rack32 to be powered from a compliant 802.3af Ethernet switch or injector. Before doing this, the jumpers marked “POE BYPASS” must be removed!
  4. 12V Power-over-Ethernet. You can use a passive injector or a modified Ethernet cable to supply 12Vdc, with positive on pins 4 and 5, and negative on pins 7 and 8. For this to work, install the jumpers marked “POE BYPASS.” These jumpers bypass the PoE regulator and allow whatever voltage is supplied on the Ethernet cable to be sent directly to the 5V regulator on the board. Without them, the power you supply on the cable won’t reach the regulator.

I2C Breakout And Pullups

The I2C Breakout header allows external boards such as the I2C RJ45 Breakout to be connected.

The Rack32 has a pair of jumpers to enable I2C pull-ups. These should generally be left in place, because the Rack32 has an onboard I2C temperature sensor. However, they can be removed if you connect an external I2C board which also includes pullups.

SPI Display

The Rack32 supports an SPI display which can be connected using an 8-way IDC cable.

Firmware Overview

Because the Rack32 is based on the ESP32, you can write your own firmware using the Arduino IDE, PlatformIO, the ESP-IDF, or your preferred environment. It includes a USB-C connection with a CP2102 USB-to-serial converter and auto-reset circuit, so you can easily upload code directly to the board.

Several different “official” firmware builds are available as part of the OXRS (Open eXtensible Rack System) project, designed to set up the Rack32 for specific applications. Each of these firmwares provides different I/O features to support different I2C expansion boards.

All OXRS firmware is designed to be configured from a web-based GUI that is loaded from your local computer. There is no need to edit the configuration, recompile, and upload it in order to change configuration options. The options are all set via the GUI and saved to flash memory.

OXRS Firmware Options

These firmware builds are available pre-compiled and ready to install:

OXRS Firmware Installation

The Rack32 ships pre-loaded with the latest release of the StateMonitor firmware, because this is the one most commonly used on the board. If you want to replace the firmware, follow this procedure.

  1. Go to the firmware page on GitHub, and click on the latest release on the right side of the page under the “Releases” heading.
  2. Download the compiled “.bin” file for either Ethernet or WiFi, depending on your preference.
  3. Download and install “esptool“, the flasher program maintained by Espressif.
  4. In a terminal, run esptool with the arguments adjusted to suit your serial port and the name of the binary to install. If you don’t know the serial port, you can use the Arduino IDE to detect the connected device, or use your operating system’s tools to show the available USB devices. A typical command for esptool would be:
esptool.py --chip esp32 --port "COM9" --baud 921600 --before default_reset --after hard_reset write_flash -z --flash_mode dio --flash_freq 40m --flash_size detect 0x10000 OXRS-SHA-StateMonitor-ESP32-FW.ino.esp32.bin

OXRS Firmware Configuration

The example OXRS firmware connects to your network and uses DHCP to obtain an IP address. You can then use the OXRS AdminUI to connect to the device and configure it.

If you have a display connected to your Rack32, you can read the IP address on the display.

If you don’t, you can use your router’s management interface to look up the list of DHCP leases and find the address of the Rack32. How you do this will depend on your router.

  1. Go to https://github.com/OXRS-IO/OXRS-IO-AdminUI-WEB-APP and download the file called “index.html” to your local computer.
  2. Open the file locally using a web browser.
  3. Enter the IP address of your Rack32.
  4. Select an action from the drop-down list.
  5. Click “Select.”
Posted on 18 Comments

#45: First look at the new Shelly Pro 4PM

UPDATE June 2022: The Shelly Pro 4PM has received its Australian certification!

For years I’ve been running my home automation switchboards using “temporary” controllers using Ethernet-enabled Arduino boards controlling DIN-rail mounted relays. My hope was that some day, someone would release a DIN-rail mounted control system with wired connectivity.

And now, all these years later, Allterco have done it. The new Shelly Pro 4PM looks like exactly the device I’ve been waiting for.

Disclosure: Allterco sent me this pre-release unit free of charge. However, I have personally paid for Shellys in the past and I’m sure I will in future. They had no input into this video, which is my own honest assessment of the Pro 4PM.

Resources

MQTT control

The Shelly Pro 4PM supports MQTT control out of the box. All you need to go is go into the MQTT configuration menu, put in the details for your broker, and it will be ready to go.

The MQTT topics are based on the device ID of the specific Shelly module, but converted to lower case. You can find the ID by opening the web interface and looking at the bottom:

The topic for sending commands to the Shelly is of the form:

shellypro4pm-<device_id>/rpc

So based on the device ID in the screenshot above, you can see the command topic would be:

shellypro4pm-84cca87e4a80/rpc

Messages are sent and received as JSON. To turn on an output, send a message to the command topic of the form:

{"id":1, "src":"user_1", "method":"Switch.Set", "params":{"id":0, "on":true}}

This example turns on the first channel, because in the “params” section it has the ID set to 0 and the “on” value set to “true”. To turn off the first channel, change the “on” value to “false”.

Turn control the second channel, use the id “1”, and so on.

To see events published by the Shelly, including when channels change state and how much power each device is using, subscribe to the topic of the form:

shellypro4pm-<device_id>/events/rpc

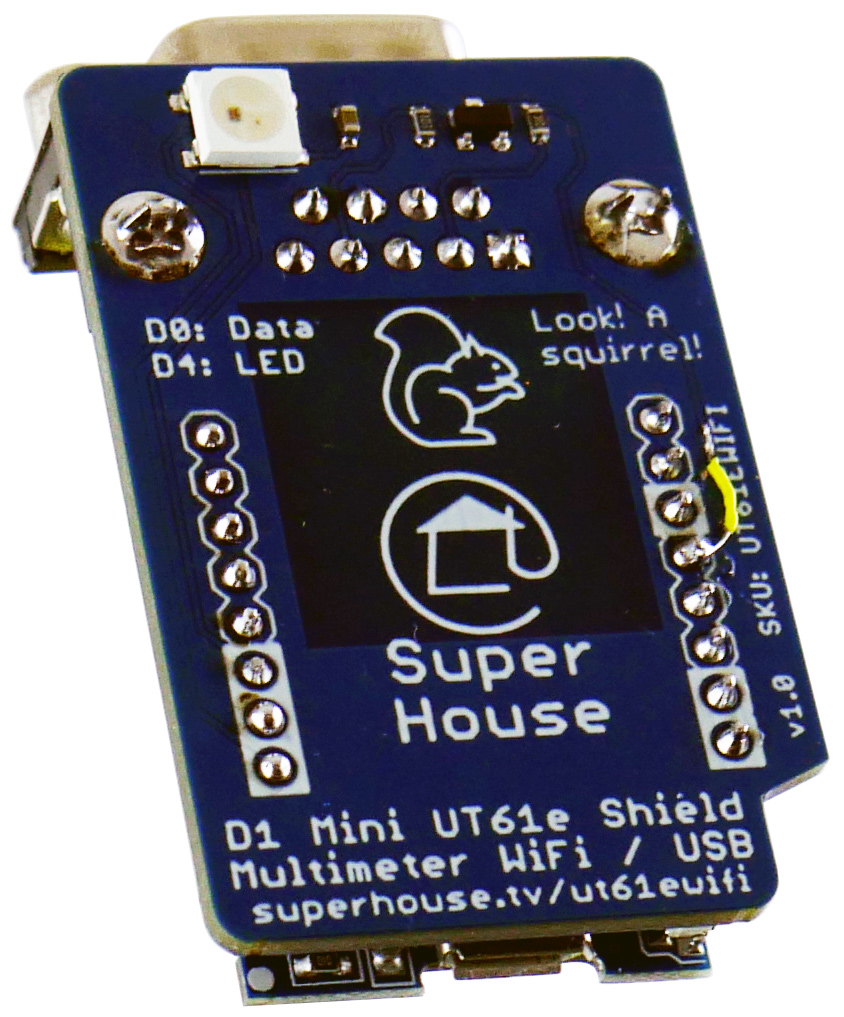
UT61E Multimeter WiFi Interface

The Uni-Trends UT61E multimeter includes an optical output so that data can be read using a computer. The multimeter ships with an RS232(-ish) cable that clips into the multimeter and provides a DB9 connector.

This module plugs into the DB9 connector on the supplied cable, and reads the data using an ESP8266 on a Wemos D1 Mini. The data can then be reported via USB or WiFi.

The example firmware reports the raw data via the USB port and also to an MQTT broker. It also shows the boot state using the RGB LED, and then blinks each time a data packet is processed.

This project was collaboratively designed on the SuperHouse livestream with the assistance of viewers.

Features

  • Fully assembled including the Wemos D1 Mini and a cable.
  • DB9 plug for connection to multimeter cable.
  • Wemos D1 Mini with USB and WiFi.
  • Powered via USB cable.
  • WS2812B RGB LED to show connection status and activity.

Resources

Quickstart Guide

Multimeter Connection

The UT61e WiFi adapter relies on the grey serial cable supplied with your multimeter to make the connection.

Remove the grey plastic cover from the top of the multimeter, and clip in the cable in its place. Unroll the cable, and plug the 9-pin D-sub connector into the WiFi adapter.

The WiFi adapter is not powered by the multimeter. It requires external power via its USB port. You can connect it to a USB hub or computer, or use a phone charger to power it.

Data Via USB

Although the WiFi adapter is designed to report data from your multimeter via WiFi, you can also see the live data stream via USB. Use a USB cable to connect the adapter to your computer, and open a serial terminal at a baud rate of 155200bps.

The Arduino IDE has a built-in serial terminal, so that’s an easy way to do it if you don’t have other serial terminal software such as CoolTerm.

On startup, the WiFi adapter also reports various configuration info to the serial console including the MQTT topics that it will use for publishing data.

Connecting To WiFi

To have the WiFi adapter connect to your WiFi network and MQTT broker, you will need to edit the configuration file and upload the firmware to the adapter.

Download or clone the UT61EWiFi repository from GitHub: github.com/SuperHouse/ut61ewifi

Inside your local copy of the repo, go into Firmware -> UT61EWiFiD1Mini and find the file called “config.h-example”. Make a copy of that file, and name it “config.h”.

Open the main source file called “UT61EWiFiD1Mini.ino” using the Arduino IDE. You will see that it automatically opens a number of tabs at the top of the editor window.

Select the tab called “config.h”, and look at the options you can change. The most important ones are the WiFi SSID and password. Change these to match your network.

The adapter relies on having access to an MQTT message broker for sending values from the multimeter to other software or devices. If you have a local MQTT broker, you can put in the IP address in the config file. If it uses authentication, you can also put in the required username and password.

There are other options in the config file, but in most cases you shouldn’t need to change them.

With the WiFi adapter connected to your computer via USB, use the Arduino IDE to compile and upload the firmware after making your required config changes.

The WiFi adapter will then reboot and attempt to connect to your WiFi. You can see the status of the connection using the LED colour on the adapter. Typically it will go through this sequence in order, although some steps may be so fast you don’t even see them:

  1. RED means the adapter is trying to connect to WiFi, but hasn’t yet connected.
  2. BLUE means it has successfully connected to WiFi, and is now trying to connect to MQTT.
  3. GREEN flashes each time it publishes a new value.

If your adapter stops at red, it can’t connect to your WiFi network. Check the values you set in the config file, and that your network supports 2.4GHz connections.

If your adapter stops at blue, it has connected to WiFi but it can’t connect to an MQTT broker. Make sure your broker is running, and that the IP address and authentication are set correctly in the config file.

If your adapter starts flashing green, everything is working and it’s publishing live data from your multimeter to MQTT!

Accessing Data Via MQTT

With the WiFi adapter publishing your live multimeter data to your MQTT broker, you can watch the datastream using an MQTT client.

First, check what topic is being used by the multimeter. The topic is generated using the chip ID of the ES8266 in the adapter, so it’s different for every adapter. Use a serial terminal to connect to the adapter at 115200bps as described above, and reset the adapter. The first messages it outputs before sending any data include the MQTT topics for both raw values and JSON messages.

Do this with the multimeter turned off so values don’t make the startup messages scroll off the terminal.

Once you know the topics, you can subscribe using an MQTT client. The command line clients included with the Mosquitto MQTT broker are good for testing. For example, you could use the mosquitto_sub client like this, with your own broker IP address and WiFi adapter device ID substituted:

mosquitto_sub -h <your_broker_address> -t "tele/<your_device_id>/JSON"

Node-RED Client

An MQTT client gives you access to the raw data, but to display it in a friendly way you need a client that can process the messages and show them in a readable form. Included in the WiFi adapter repository is a Node-RED client.

The Node-RED client has its own README file that explains some of the configuration options. You can find it in the “Clients” section of the WiFi adapter repository: github.com/SuperHouse/UT61EWIFI/tree/main/Clients/Node-RED

Tasmota conversion: DETA 6922HA double power point

The DETA 6922HA is a two-outlet power point with Australian sockets, touch control, and WiFi.

Brand: DETA
SKU: 6922HA
Description: Double power point
Module: Tuya TYWE3S

Warning: Do not perform this conversion with mains power connected to the device! It must be entirely disconnected before you begin.

Parts and tools required

  • Philips-head screwdriver
  • 3.3V USB-to-Serial converter with jumper wires OR ESPFlasher with breakout cable
  • Jumper wires
  • Soldering iron

1: Access the controller

NOTE: There is no need to remove the blue rear cover. Everything can be accessed from the front.

  1. Pop off the front scratch-plate. It can be quite tight. You need to remove this to install the GPO anyway.
  2. Remove the two Phillips-head screws on either side of the touch buttons.
  3. Remove the clear plastic cover.
  4. Grasp the controller PCB (with the buttons on it) and pull it out of the device. It sits in a 4-way pin header and should come out easily. The only thing holding it in place is the pin header.
  5. This controller PCB is all you need to complete the flashing. Put the rest of the device aside.

2: Attach programming connections

  1. Most of the connections you need are exposed on the PCB:
  1. However, the reset pin (ESP_EN) is covered by a glob of silicon. You can cut the silicon away, but alternatively you can simply loop GPIO0 around to GND:
  1. Connect a USB-to-Serial converter with 3.3V I/O, or a specialised flashing device such as the ESPFlasher.
  2. Plug it into your computer using a USB cable.

3: Install Tasmota using Tasmotizer

  1. Open Tasmotizer on your computer. If you don’t have Tasmotizer installed, see SuperHouse #37: Install Tasmota using Tasmotizer.
  1. Select the USB port for your USB-to-Serial converter or ESPFlasher.
  2. Under “Select image”, choose “Release”.
  3. Turn off “Self-resetting device”.
  4. Turn on “Erase before flashing”.
  5. Click “Tasmotize!” and wait about a minute for the process to complete.

4: Configure using Tasmotizer

  1. Disconnect the USB cable from your computer.
  2. Unsolder the jumper wire between GPIO0 and GND.
  3. Plug the USB cable back into your computer.
  4. Go to the Tasmota templates site and find the page for this device. The latest version of the template will always be at the templates site, so refer to that for the most up to date information. Copy the template.
  5. In Tasmotizer, click “Send config” to open the configuration dialog box:
  1. Enter your WiFi and MQTT details to suit your network.
  2. In the “Module/template” section, select “Template”.
  3. Paste the template that you copied from the Tasmota templates site into the template text box.
  4. Click “Save” to send the config to the module. This will happen almost instantly.

5: Remove programming connections

  1. Disconnect the USB cable from your computer.
  2. Unsolder the connections from your programmer to the module.

6: Reassemble

  1. Push the control board back into place in the power socket.
  2. Place the clear plate over the control board and screw it into place.

Done! Your power socket now has Tasmota installed, and is ready to use.